
Module 1.1 – Shoreline Analyst


Shoreline Analyst (Developed)
(Mapping and analysis of the position of the past coastline)
This module is already in operation (https://cassiengine.org) and details of the methodology used for its development are described in Almeida et al. (2021, <https://doi.org/10.1142/9789811275135_0147>). Using this module, it is possible to map past coastlines in any region of the planet, from 1984 to the present. Through these lines, [Shoreline Analyst] (Figure 1) determines the rate of evolution of the coastline (ECL), in meters per year, indicating the evolutionary trend of the position of the coastline.
The coastline at each moment is obtained through algebraic operations using the different bands of the satellite image (Normalized Difference Water Index – NDWI, described by McFeeters (1996, <https://doi.org/10.1080/01431169608948714> ) ), in addition to a classification carried out using the Otsu method (1979, <https://cw.fel.cvut.cz/b201/_media/courses/a6m33bio/otsu.pdf>). From a baseline, and with transects spread across this line at intervals (the spacing between transects is defined in advance), it is possible to calculate the distance from the coastline to the baseline for each transect, on each date chosen in the analysis. In this way, having such information in a two-dimensional plane, where the distance from the coastline to the baseline in a given transect is given by Y, depending on the date on which the image was captured (X), it is possible to perform a regression linear and define an equation that describes the position in Y for a future X (in a given transect). The ECL rate being the value of “Y” for a linear regression (ax+b).
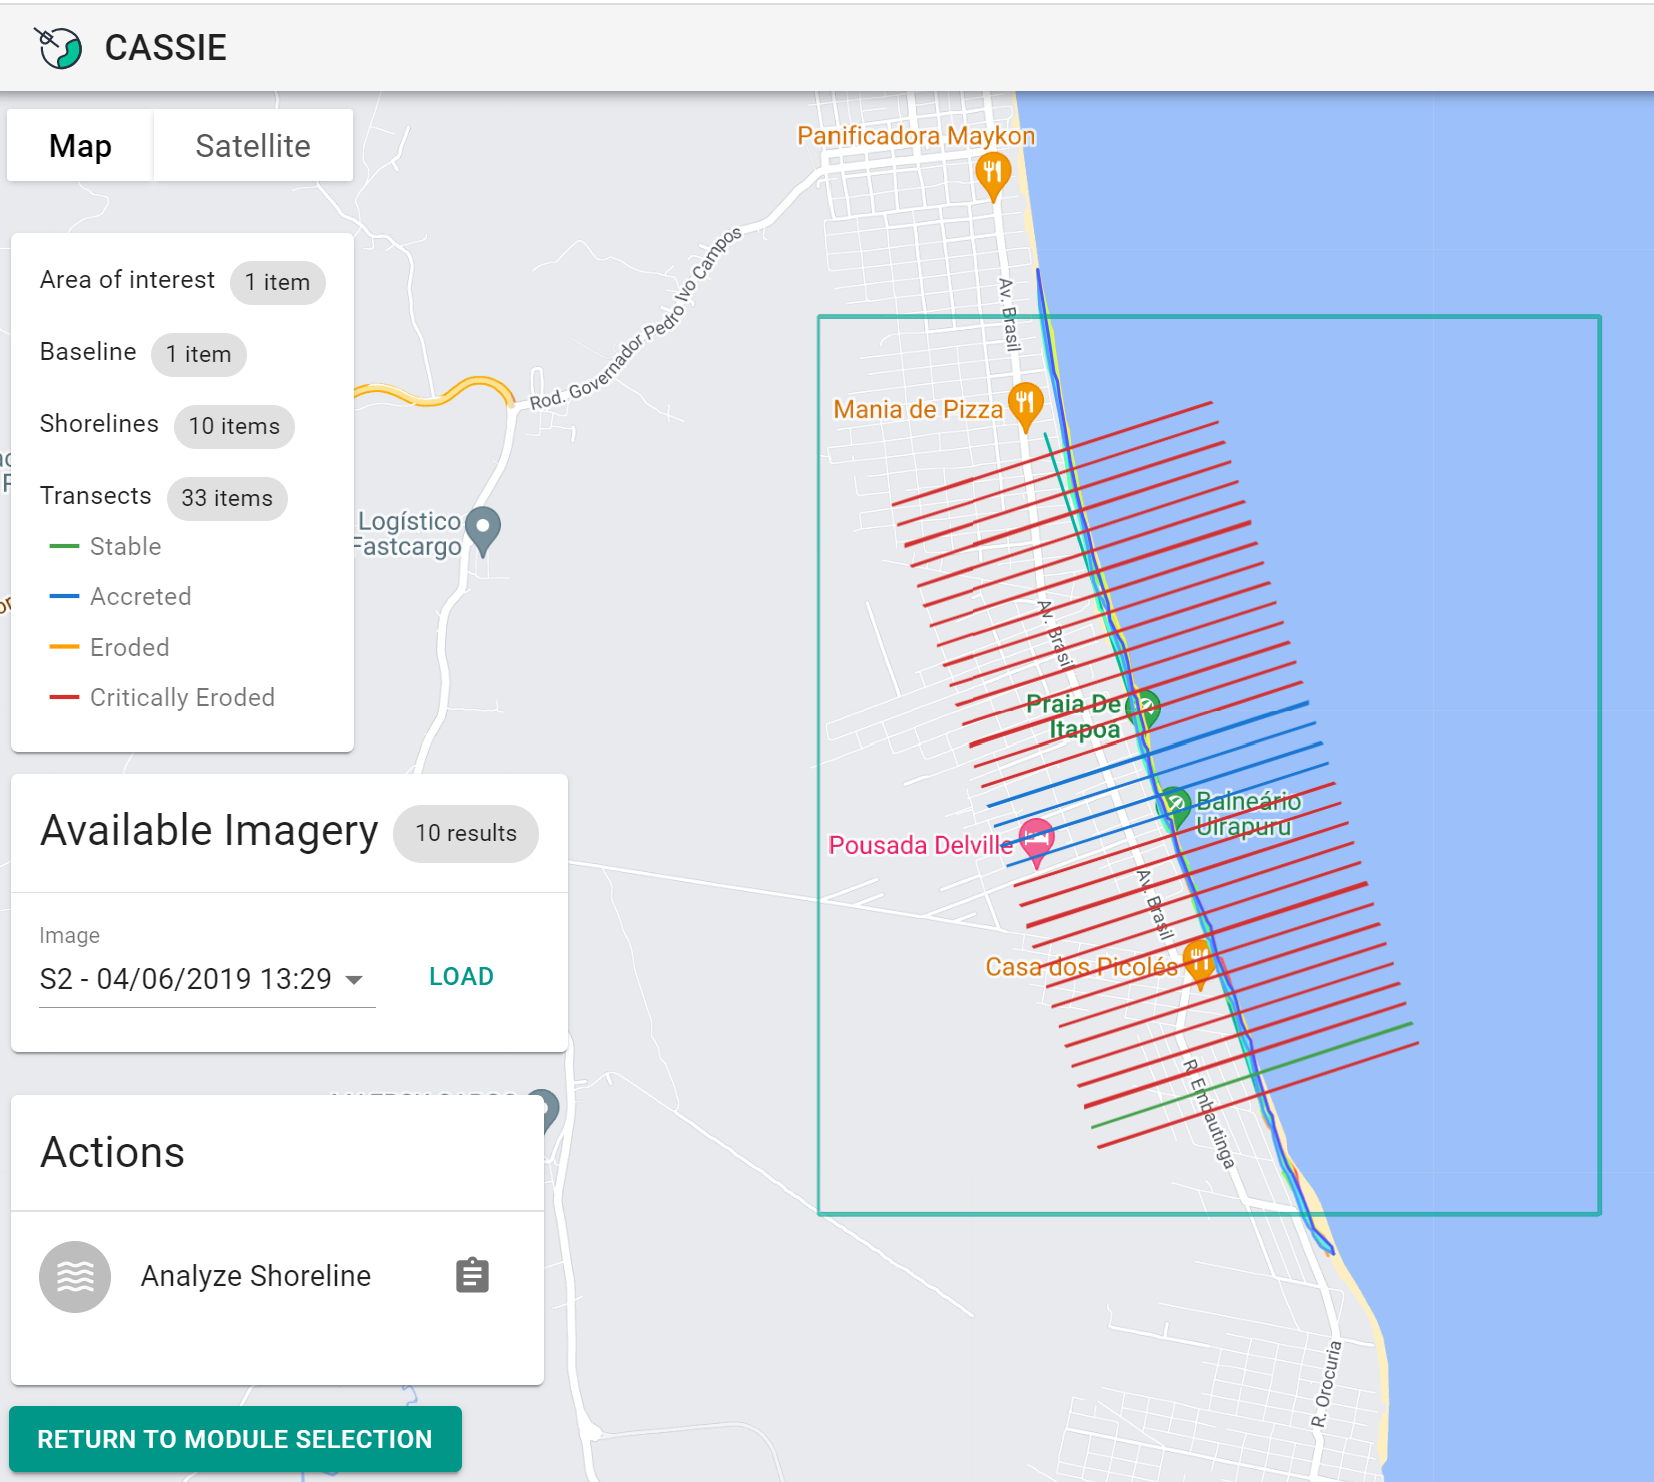
Figure 1. Shoreline Analyst module being used on the Cassie CoRe® platform for the Santa Catarina state. (Source: https://cassiengine.org/, 2022)

