
Module 1.4 – Bathymetry


Bathymetry (prototype under test)
(Methodology for obtaining satellite-derived bathymetry)
Knowledge of bathymetry is crucial in determining scenarios associated with climate change in coastal areas, that is, they serve as boundary conditions in numerical modeling, which requires updated bathymetry to predict, for example, flood levels given local hydrodynamics (Alves et al., 2014, <https://doi.org/10.1016/j.marpolbul.2014.06.034>). Satellite-Derived Bathymetry (BDS) is a useful technique for mapping shallow water bathymetry, characterizing the coastal area, and monitoring seafloor changes that may have occurred since the last bathymetric survey carried out (Lyzenga, 1978, <https:/ /opg.optica.org/ao/abstract.cfm?URI=ao-17-3-379>).
BDS exploits the physical principle that different wavelengths of the light spectrum are attenuated by water to varying degrees, and thus it is possible to make depth-field estimates due to optical inversion of bottom reflectance (Philpot, 1989, <https://opg.optica.org/ao/abstract.cfm?URI=ao-28-8-1569>). This procedure has proven to be effective, especially when using multispectral satellite images and presents advantages such as extensive area coverage and repeatability (Nordman et al., 1990). Sublittoral bathymetry can be obtained using the algorithm developed by Stumpf et al. (2003, <https://doi.org/10.4319/lo.2003.48.1_part_2.0547>), which estimates depth through the ratio of the natural logarithm between the reflectance of two bands, assuming that both bands are affected equally by the atmosphere, water column and contribution of seabed reflectance (Eq. 1).
𝑅𝐵 = (ln(𝑛𝑅𝑤(𝜆𝑖) ln(𝑛𝑅𝑤(𝜆𝑗)) [Eq. 1]
Where RB is the band ratio model proposed by Stumpf et al. (2003) still without vertical reference, n is a constant to ensure that the ratio remains positive in all values, Rw(𝜆i) is the surface reflectance of band i and Rw(𝜆j) is the surface reflectance of band j. The relationship between the RB model and local bathymetry is typically described using second degree polynomial regression (Eq. 2) as used by Vilar et al. (2018, <https://www.researchgate.net/publication/331135587>):
𝑍𝑠𝑎𝑡= m2 (𝑅𝐵)² + m1(𝑅𝐵) + m0 [Eq. 2]
Where, Zsat is the depth estimated by the satellite, RB is the result of the algorithm from Equation 1, m1 and m2 are the curve adjustment coefficients that size the reference depth and m0 is the tide adjustment offset. According to Filippi (2020, <https://repositorio.ufsc.br/handle/123456789/209992>) the best band ratio for estimating bathymetry in Babitonga Bay (SC, Brazil) can be described by the algorithm.
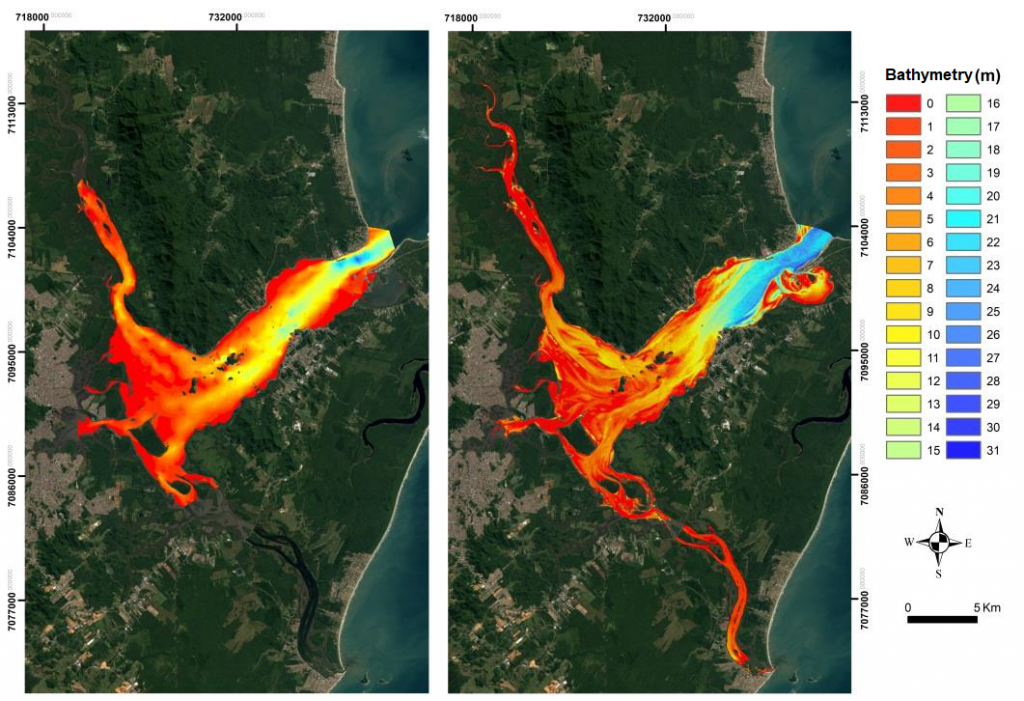
Figure 1. Example of the comparison between bathymetry measured by single-beam echosounder (in situ) and satellite-derived bathymetry (BDS) with Sentinel 2 image (Copernicus) in the estuarine zone of Babitonga Bay (Santa Catarina, Brazil).
To create the satellite-derived bathymetry module [Bathymetry], Equations [1 and 2] will be implemented in JavaScript code (programming language used by the GEE platform). Additionally, the [Bathymetry] module will have algorithms for selecting suitable pixels for optical inversion processing (removal of clouds, shadows, areas with high suspended sediment, etc.) as well as methodologies for optimizing the temporal interval of images to be used ( e.g., median images from a set of images) and different mathematical models for generating the inversion model (final step in creating an optical inversion model).

